Reporters
When all suites have been executed, the results are collected and processed by reporters.
typescript
/**
 * A reporter allows you to export results of your benchmark in different formats.
 *
 * @param result The result of all suites.
 * @param context An object contains utility functions and informational bits.
 */
export type Reporter = (result: ESBenchResult, context: HostContext) => Awaitable<unknown>;
Set reporters in config:
javascript
import { defineConfig, textReporter, csvReporter, rawReporter, htmlReporter } from "esbench/host";

export default defineConfig({
	reporters: [
		textReporter(),
		csvReporter(),
        rawReporter(),
        htmlReporter(),

        // Customize
		(result, context) => {/* ... */},
    ],
    // Default:
	// reporters: [textReporter()]
});
Built-in Reporters
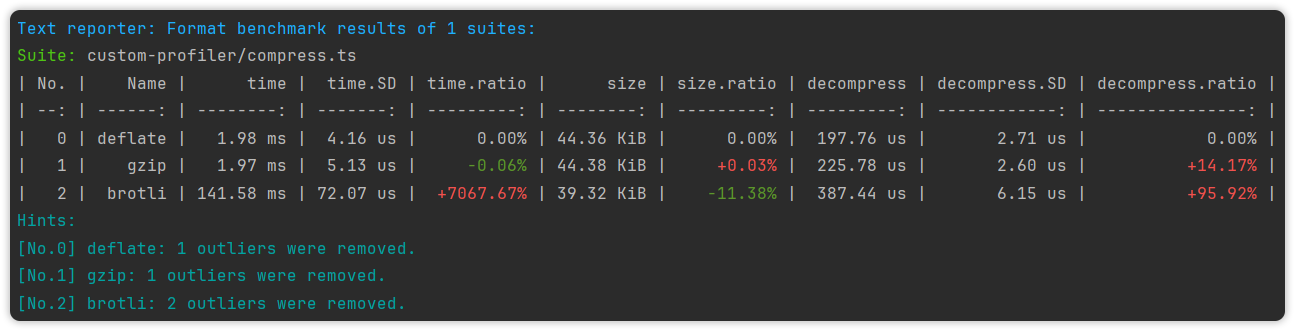
Text Reporter
Format the results into Markdown tables with additional hints and output them to various streams.
typescript
import { textReporter, defineConfig } from "esbench/host";

export default defineConfig({
	reporters: [
		// This is default applied.
		textReporter(),

		textReporter({
			// Write the report to a text file.
			file: "/path/to/report.txt",

			// Set to false to avoid print the report to console.
			console: false,

            // ...SummaryTableOptions (see ↓)
        }),
	],
});

interface SummaryTableOptions {
	/**
	 * Show standard deviation (*.SD) columns in the table.
	 *
	 * @default true
	 *
	 * @example
	 * textReporter({ stdDev: true })
	 * | No. |      Name |    time | time.SD |
	 * | --: | --------: | ------: | ------: |
	 * |   0 | For-index | 0.37 ns | 0.01 ns |
	 * |   1 |    For-of | 6.26 ns | 2.88 ns |
	 */
	stdDev?: boolean;

	/**
	 * By default, variables with only one value are omitted from the table.
	 * Set to true to show all variables.
	 *
	 * @default false
	 */
	showSingle?: boolean;

	/**
	 * Show percentile columns in the table.
	 *
	 * @example
	 * textReporter({ percentiles: [75, 99] })
	 * | No. |   name |      time |  time.p75 | time.p99 |
	 * | --: | -----: | --------: | --------: | -------: |
	 * |   0 | object | 938.45 ms | 992.03 ms |   1.08 s |
	 * |   1 |    map |    1.03 s |    1.07 s |    1.1 s |
	 */
	percentiles?: number[];

	/**
	 * Specifies which outliers should be removed from the distribution.
	 *
	 * @default "all"
	 */
	outliers?: false | "worst" | "best" | "all";

	/**
	 * Using ratioStyle, we can override the style of the diff and the baseline column.
	 *
	 * @example
	 *            "percentage"      "trend"       "value"
	 *    time   | time.ratio | | time.ratio | | time.ratio |
	 * 117.26 us |      0.00% | |    100.00% | |      1.00x | (baseline)
	 * 274.14 us |   +133.79% | |    233.79% | |      2.34x |
	 *  19.82 us |    -83.10% | |     16.90% | |      0.17x |
	 *
	 * @default "percentage“
	 */
	ratioStyle?: RatioStyle;
}
Output example:
Raw Reporter
Save the results to a JSON file without format The file can be read by esbench report and used for diff option in config.
CSV Reporter
Export the results to CSV files. Files are saved in the specified directory with the path of the suite filename + .csv.
javascript
import { csvReporter, defineConfig } from "esbench/host";

export default defineConfig({
	reporters: [
		// Save as CSV files in reports/
		csvReporter(),

		csvReporter({
            directory: "/folder/to/save/files",
            // ...SummaryTableOptions (see Text Reporter)
        }),
	],
});
HTML Reporter
Plot the results in interactive chart. It is also available in playground.
javascript
import { defineConfig, htmlReporter } from "esbench/host";

export default defineConfig({
	reporters: [
		// Save the HTML report to reports/benchmark.html
		htmlReporter(),

        // Specify the file path.
		htmlReporter("/path/to/save.html"),
	],
});
The page looks like:
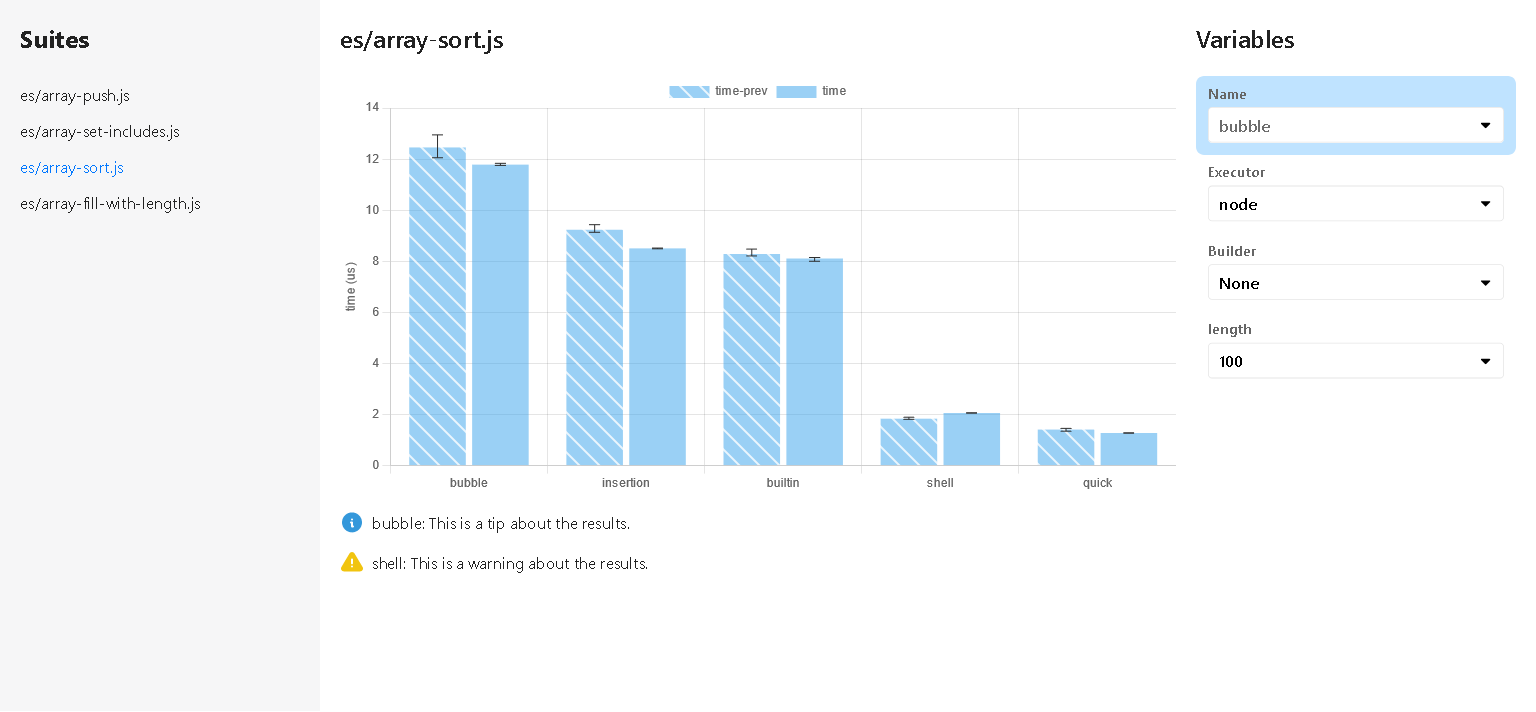
- The left is the benchmark suite menu.
- Middle top is the chart, X-axis is the current variables, Y-axis is metrics. If there are multiple metrics for a case, each will be displayed in different color, and the previous value will be patterned.
- Middle bottom contains additional information.
- On the right are the filters, each variable of the suite has a select box and the highlighted item (click the label to switch) will be used as the X-axis.